
Standards in reporting are crucial not just for saving time, but for extracting the insight and acting upon it as well. This helps support management, which is crucial for running a successful business. Standards in reporting are why flexxus has chosen to partner with Hi-Chart.
This partnership allows Canadian companies to improve and enhance their reporting capabilities in connection with a wide range of business tools, from Excel to Power BI to SAP/IBM, using data from over 150+ sources.
Successful Reporting with Hi-Chart®
With hi-chart®, creating sophisticated management reports, presentations and interactive dashboards is as simple as a few clicks.
From within Excel or any modern web browser, users can apply a range of pre-built FP&A and other business reporting templates, driven by the data sources of their choice. This may include data from a range of third-party systems, such as flexxus’ ERP solutions. By using hi-chart®, companies can easily provide consistency in their reporting, giving report consumers greater business insights for decision-making.
Standardized reporting made easy
Studies have shown that with modern notation standards, reports are understood much more quickly, and misunderstandings are significantly reduced.
With hi-chart, you can easily implement modern notation standards throughout your company. The solution’s user-friendliness increases acceptance among report authors with a business administration focus, while managers are instantly won over by the clarity of the reports and the ease by which they can be read.
Hi-Chart provides market-leading reporting and analytics solutions to add clarity to business communication and improves the quality of decision-making across the organization.
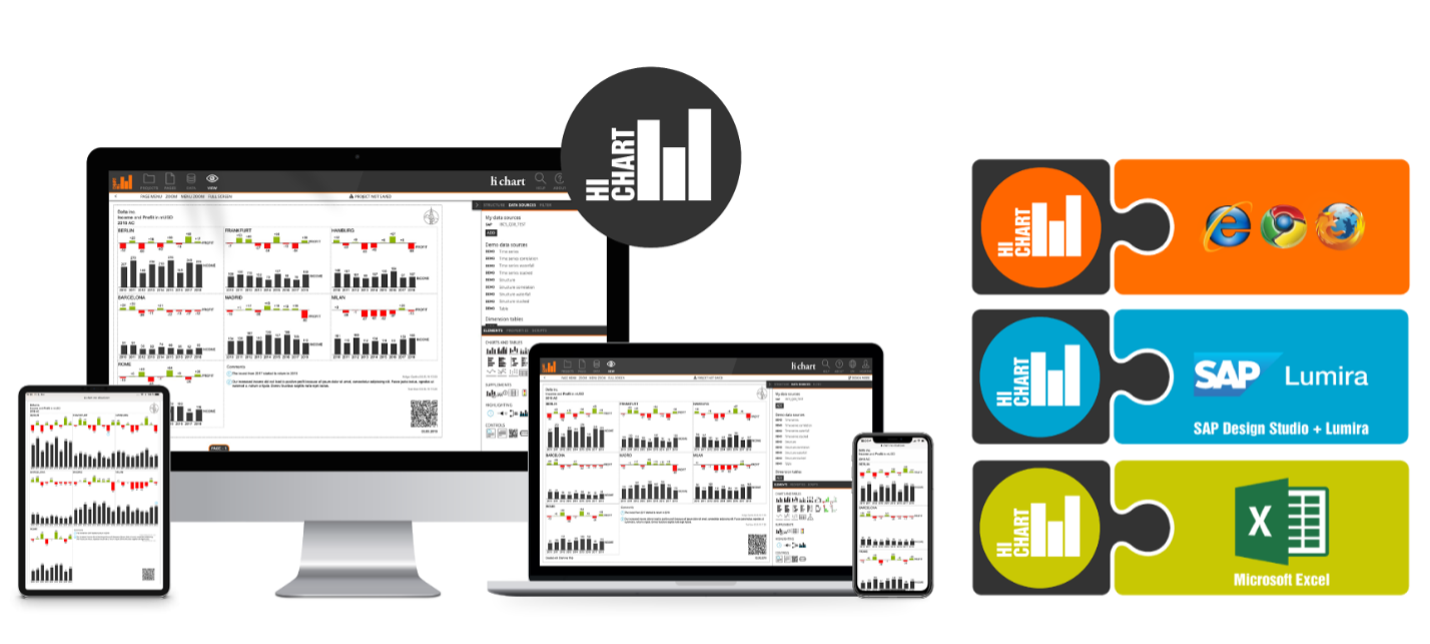
Whether in the cloud or on-premise, hi-chart® is platform-agnostic and seamlessly integrates into existing IT infrastructures, including connectors to more than 150 third-party systems such as IBM Cognos TM1. Hi-Chart’s solution also integrates with a range of frontend tools including Power BI, Qlik, SAP Lumira, SAP Analytics Cloud, other BI platforms, and of course Microsoft Excel.